Most eCommerce Reporting Doesn’t Tell You What You Need to Know
You’ve got your GA4 setup. Maybe you’re tracking revenue in Shopify, Magento, BigCommerce, or WooCommerce, or you have custom reports set up in Google Analytics 4. But when someone on your team asks:
- Which products are getting a ton of traffic but not selling?
- What’s converting best by region or channel?
- Where are we leaking revenue this week?
You probably don’t have a clean, fast answer. That’s the exact problem we set out to solve with our Real-Time Product Performance Report, which we built after seeing too many clients flying blind, wasting ad spend, and making inventory decisions based on stale, incomplete data.


You Don’t Just Need Sales Data – You Need Behavior + Conversion Context
Sales data alone isn’t enough. You need to know:
- What products people are looking at
- What they’re adding to cart
- Which SKUs are almost converting
- Where your best customers are coming from
- And what’s working right now, not last month
And you need it without spending hours stitching together reports from Google Analytics, Meta Ads, Merchant Center, and your store backend.
We built this dashboard to do exactly that – and update in real time, not 24 hours later.
What This Report Actually Shows You
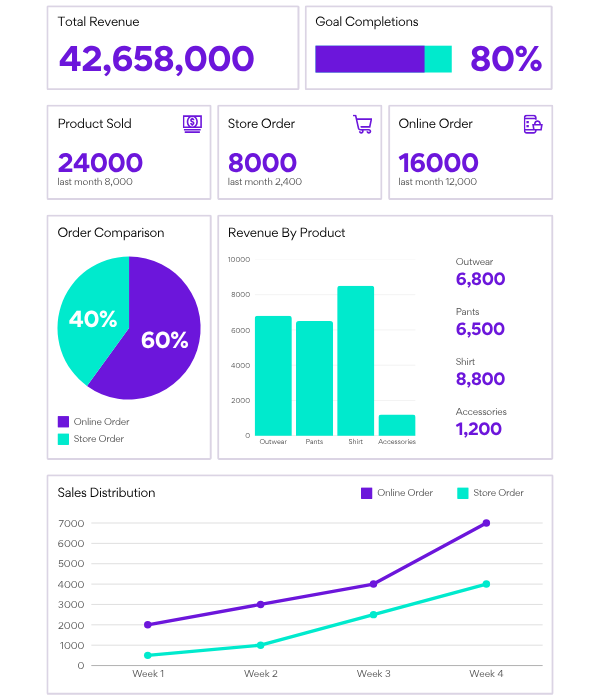
This isn’t one of those fluffy dashboards that just show top sellers and a pie chart. It’s built to give eCommerce teams and growth leads actionable, SKU-level insight in minutes.
It’s a real-time report where, if someone says, “Why does Product X have the highest sales this week?”
You can pull up the exact data in 15 seconds, broken down by region, channel, and device.
Core Product Behavior
- Total product views: Who’s looking, and how often
- Add to cart count: Interest without purchase? Time to investigate
- Item value: Measure the KPIs with the item price
- Purchases: Units sold per SKU
- Total revenue per product: Not just sales count, but $
- Quantity sold: Useful for bundling, volume, and inventory planning
- Cart-to-purchase rate: Spot friction fast
Audience & Traffic Breakdown
- Regions: See what’s converting in the US vs. Canada
- Source/Medium: Organic? Google Ads? Meta? See who’s driving what
- Device: Useful if something’s broken on mobile or underperforming on desktop
- Landing page behavior: see if users bounce or engage after landing on specific product pages.
- Campaign source attribution: understand which campaigns are driving which SKUs, not just overall revenue.
Filters & Sorting You’ll Actually Use
- Sort by: Revenue, cart adds, purchases, view-to-cart %, etc.
- Filter by: Region, traffic source, product category, SKU, or date range
- Compare by: Date range, month, year, historical data comparaisions
- Break down by device + region combo to catch mobile-specific issues in key markets.
- Sort by cart abandonment rate to spot high-interest but low-conversion products.
How To Use These Reports to Grow Smarter (and Stop Wasting Money)
Make Smarter Ad Decisions
Let’s say you’re running Google Shopping or Meta campaigns. This dashboard tells you:
- Which products are getting the clicks but not converting
- Which SKUs are performing by source
- Where to pause spend (and where to double down)


Fix Product Page Friction
High product views + low add-to-cart rate? That usually means:
- Bad images
- Confusing variant options
- Poor price-to-value perception
- Or something broken (mobile image zoom, anyone?)
With this report, you can find those patterns and fix them before the week is over.
Improve Merchandising and Restocking
Use real-time behavior data to guide inventory planning, bundling, and product promotion decisions.
- Spot early demand spikes for trending SKUs before competitors catch on.
- Use cart quantity trends to guide upsell and bundle opportunities.
- Align promotions with real-time purchase behavior, not last month’s sales report.


Align the Marketing and Merchant Teams
Give both teams access to the same product insights to drive faster, smarter decisions.
- Everyone sees the same SKU-level performance data – no debates, just facts.
- Merchandising knows what to push based on live demand, not last quarter’s data.
- Sync campaigns with restock cycles to avoid promoting out-of-stock products.
125+
Happy Clients
1200+
Managed Campaigns
20+
100%
Success Rate
How We Build This at XtremeUX
We connect:
- GA4 events (view_item, add_to_cart, purchase)
- Google Ads + Merchant Center
- Shopify, Magento, WooCommerce, or BigCommerce
- Google Search Console data
We compile it all into a custom Looker Studio report, complete with product metadata, clean filters, and logic that makes it usable, even for non-technical users. It’s not a cookie-cutter template. We build this around your product catalog and business priorities.
Certified Professionals. Proven Results.


Request For A Free Report
A Quick Story: How One Furniture Brand Found 3 Hidden Winners
A DTC luxury furniture client spending ~$50K/month on Google ads came to us because sales had stalled. They were promoting 4,600 SKUs like crazy, running ads constantly, but didn’t know what was actually working.
- 300+ products with high add-to-cart rates that weren’t even featured in campaigns.
- 1,400+ top-clicked SKUs with zero purchases (broken mobile gallery).
- Meta was spending $1,800/month on low-converting SKUs with zero revenue.
- 450+ of the products drove over 15% of sales in first-click interactions.
- 230+ products consumed the 15% ad spend, but zero sales because of the pricing.
6 weeks later:
- ROAS up 27% for top-selling brands
- AOV up 14% for the first-time buyers
- Increased 15% sales from the in-house brand’s products
- Inventory turnover improved for high-margin products